Skip to content
Research Notes

Archively Research Note 01

Figure 3 of 4, from When Does an AI Proposal Become Archival Description?, placed in section 6, Review depth follows use and consequence.

Figure 3Interactive

Review depth changes with use and consequence

Change the intended use or select an output class.

Output class, and the tier it falls in at this use

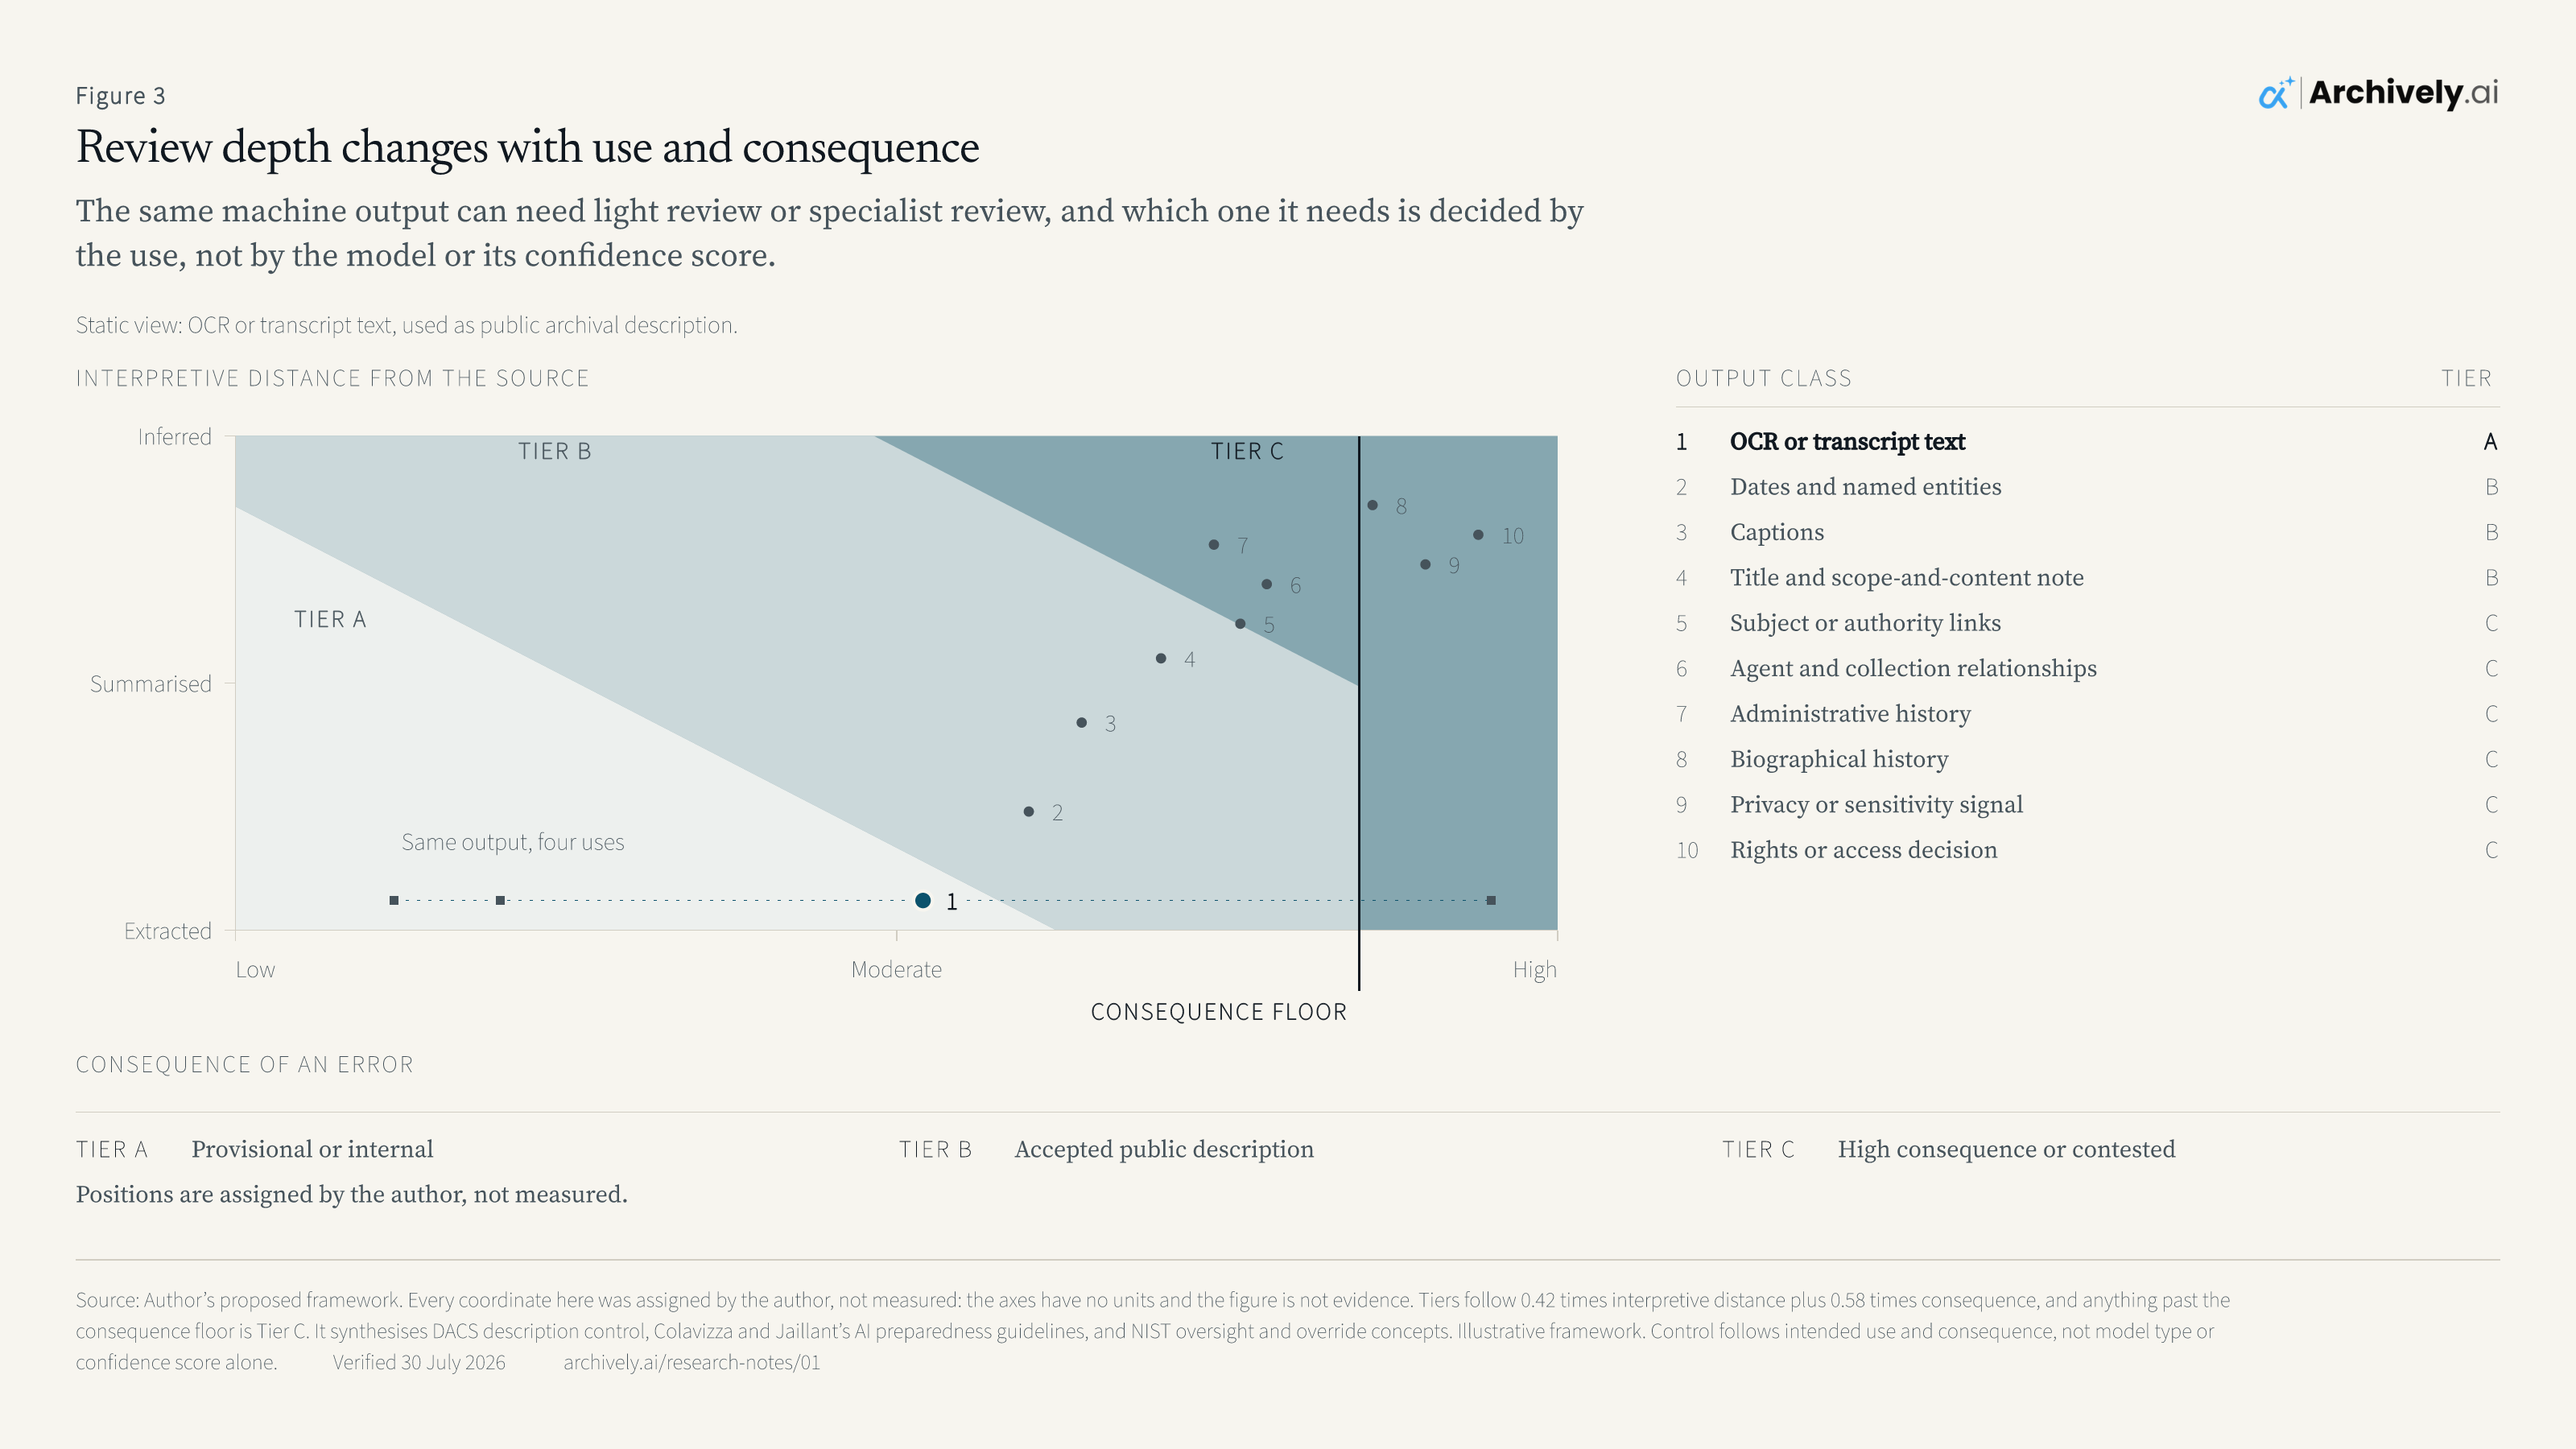
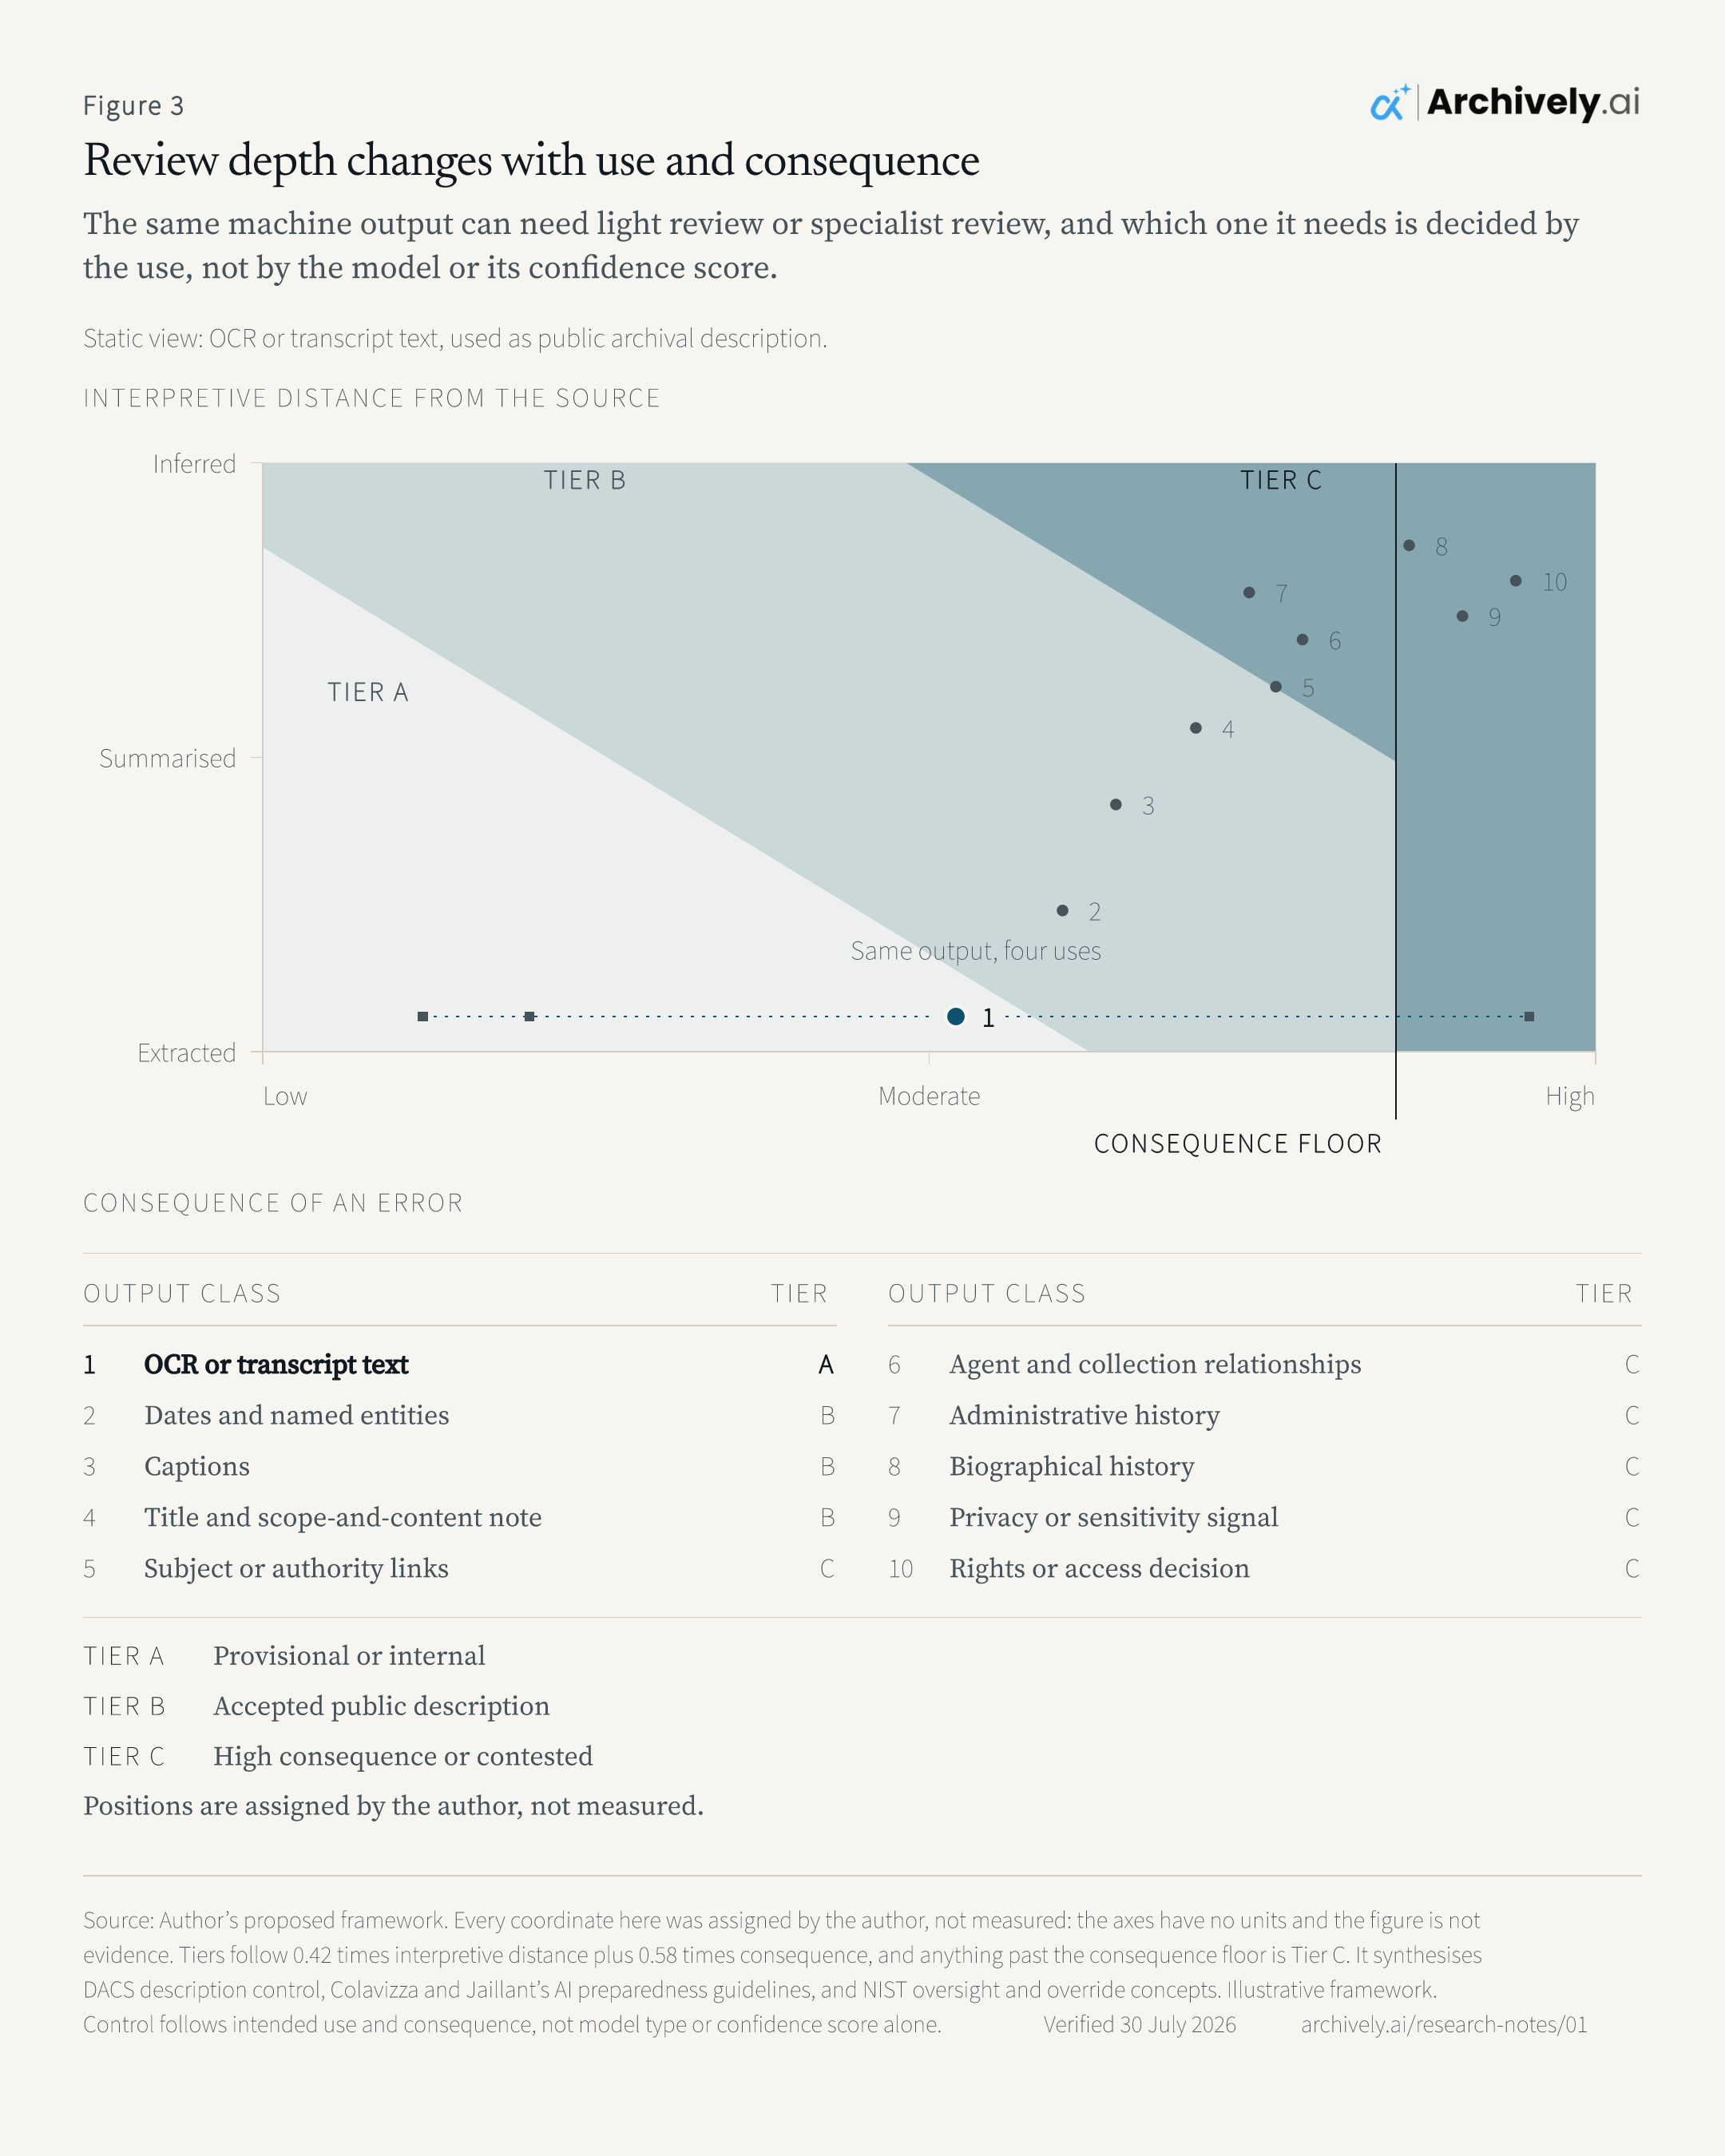
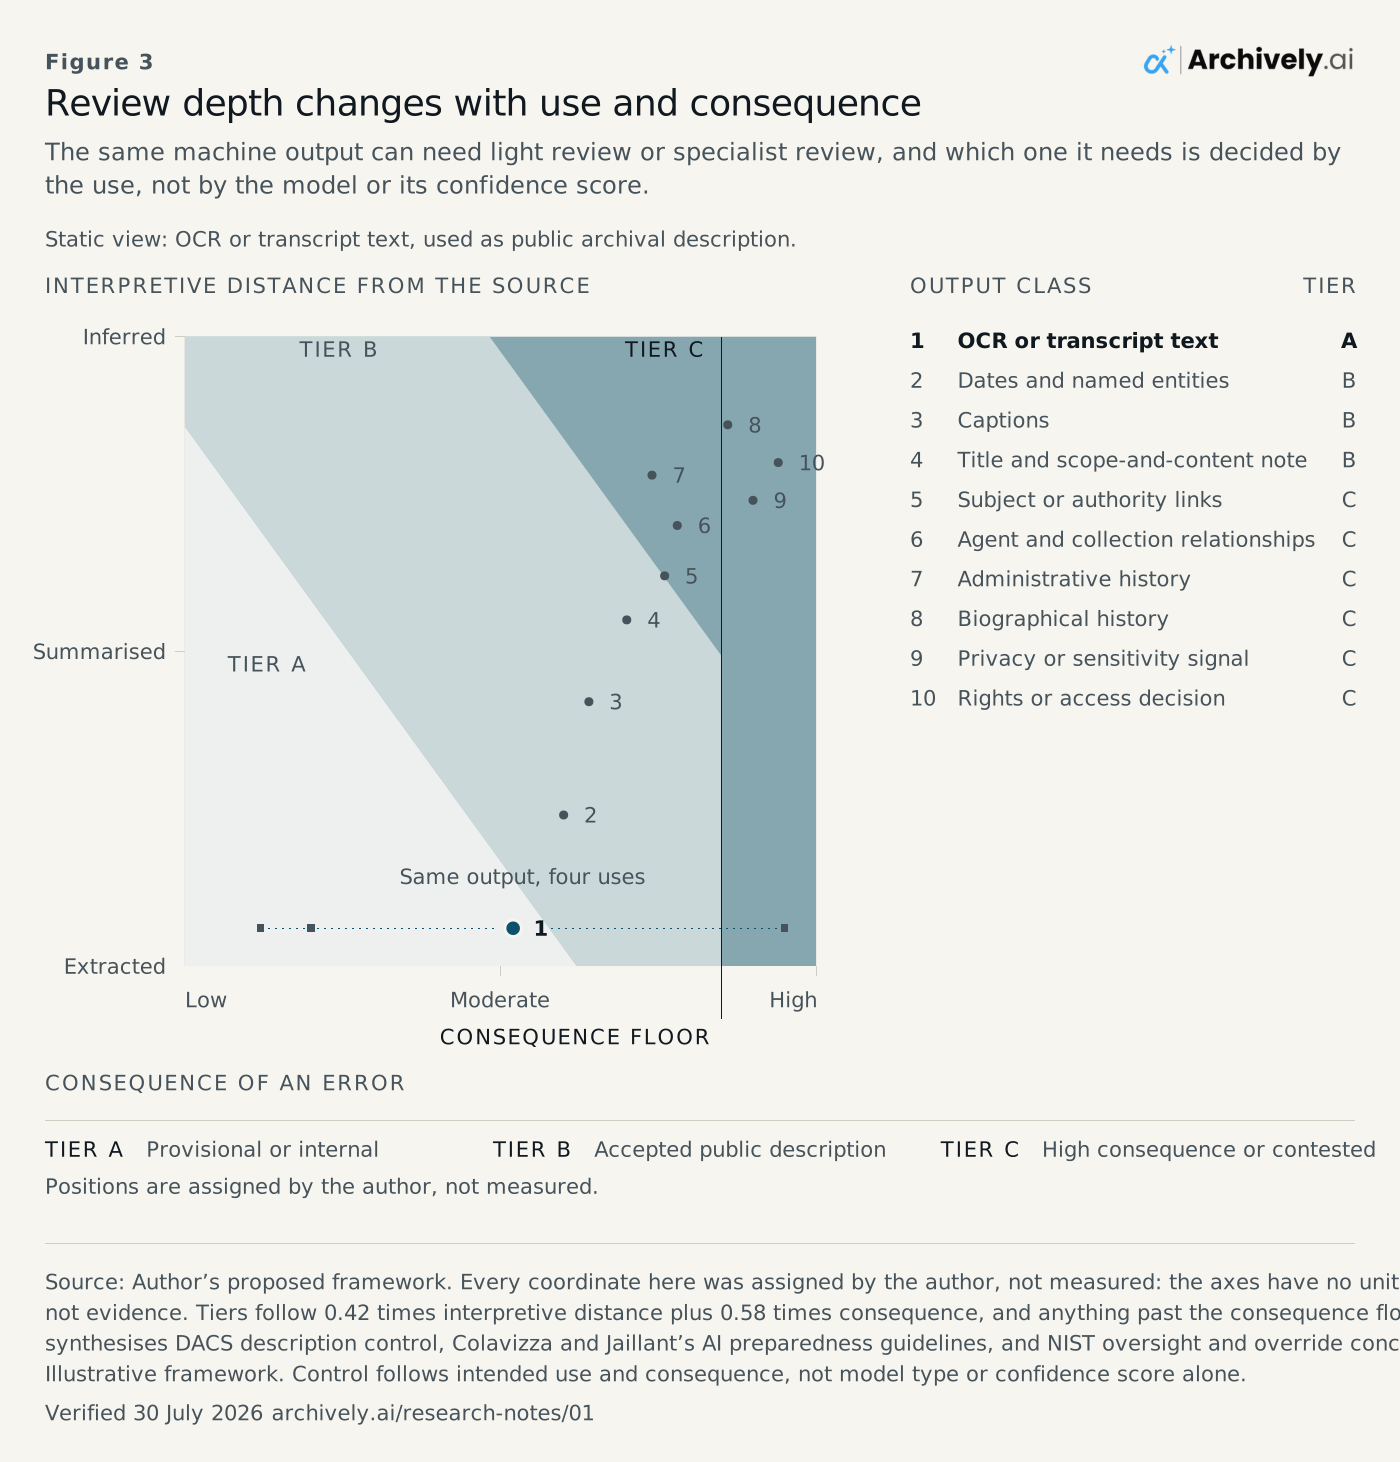
Figure 3. Review depth changes with use and consequenceA scatter plot. The horizontal axis is the consequence of an error, labelled low, moderate and high. The vertical axis is interpretive distance from the source, labelled extracted at the bottom, summarised in the middle and inferred at the top. Three shaded bands run diagonally across the plot, light to deep, each carrying its own name: Tier A, provisional or internal, at the lower left; Tier B, accepted public description, across the middle; Tier C, high consequence or contested, at the upper right. A single vertical rule near the right of the plot marks the consequence floor, past which the tier is C however mechanical the output is. Ten output classes are plotted as small filled circles with their numerals set beside them: transcript text, dates and named entities, captions, title and scope note, authority links, relationships, administrative history, biographical history, sensitivity signal, and rights decision. A numbered key gives each class its name and the tier it falls in under the intended use currently shown. The figure opens on an example: class 1, OCR or transcript text, used as public archival description. That point is drawn larger, in archival blue, on a dotted line marked same output, four uses, whose four square stops are the positions the same class would take under each of the four intended uses. Choosing a different intended use, from internal discovery aid, staff working draft, public archival description, and rights or access decision, moves every point horizontally and can change its tier. A full table of tiers by output class and intended use follows the figure.INTERPRETIVE DISTANCE FROM THE SOURCELowExtractedModerateSummarisedHighInferredCONSEQUENCE FLOORTIER ATIER BTIER C12345678910CONSEQUENCE OF AN ERRORTIER AProvisional or internalTIER BAccepted public descriptionTIER CHigh consequence or contestedPositions are assigned by the author, not measured.Figure 3. Review depth changes with use and consequenceA scatter plot. The horizontal axis is the consequence of an error, labelled low, moderate and high. The vertical axis is interpretive distance from the source, labelled extracted at the bottom, summarised in the middle and inferred at the top. Three shaded bands run diagonally across the plot, light to deep, each carrying its own name: Tier A, provisional or internal, at the lower left; Tier B, accepted public description, across the middle; Tier C, high consequence or contested, at the upper right. A single vertical rule near the right of the plot marks the consequence floor, past which the tier is C however mechanical the output is. Ten output classes are plotted as small filled circles with their numerals set beside them: transcript text, dates and named entities, captions, title and scope note, authority links, relationships, administrative history, biographical history, sensitivity signal, and rights decision. A numbered key gives each class its name and the tier it falls in under the intended use currently shown. The figure opens on an example: class 1, OCR or transcript text, used as public archival description. That point is drawn larger, in archival blue, on a dotted line marked same output, four uses, whose four square stops are the positions the same class would take under each of the four intended uses. Choosing a different intended use, from internal discovery aid, staff working draft, public archival description, and rights or access decision, moves every point horizontally and can change its tier. A full table of tiers by output class and intended use follows the figure.INTERPRETIVE DISTANCE FROMTHE SOURCEExtracted at the foot, summarised in themiddle, inferred at the top.LowModerateHighCONSEQUENCE FLOORTIER ATIER BTIER C12345678910CONSEQUENCE OF AN ERROROUTPUT CLASSTIER1TranscriptA2Dates, entitiesB3CaptionsB4Title, scope noteB5Authority linksC6RelationshipsC7Admin historyC8Biographical noteC9Sensitivity signalC10Rights decisionCTIER AProvisional or internalTIER BAccepted public descriptionTIER CHigh consequence or contestedPositions are assigned by the author, notmeasured.Figure 3. Review depth changes with use and consequenceA scatter plot. The horizontal axis is the consequence of an error, labelled low, moderate and high. The vertical axis is interpretive distance from the source, labelled extracted at the bottom, summarised in the middle and inferred at the top. Three shaded bands run diagonally across the plot, light to deep, each carrying its own name: Tier A, provisional or internal, at the lower left; Tier B, accepted public description, across the middle; Tier C, high consequence or contested, at the upper right. A single vertical rule near the right of the plot marks the consequence floor, past which the tier is C however mechanical the output is. Ten output classes are plotted as small filled circles with their numerals set beside them: transcript text, dates and named entities, captions, title and scope note, authority links, relationships, administrative history, biographical history, sensitivity signal, and rights decision. A numbered key gives each class its name and the tier it falls in under the intended use currently shown. The figure opens on an example: class 1, OCR or transcript text, used as public archival description. That point is drawn larger, in archival blue, on a dotted line marked same output, four uses, whose four square stops are the positions the same class would take under each of the four intended uses. Choosing a different intended use, from internal discovery aid, staff working draft, public archival description, and rights or access decision, moves every point horizontally and can change its tier. A full table of tiers by output class and intended use follows the figure.Figure 3ArchivelyReview depth changes with use and consequenceSource: Author’s proposed framework. Every coordinate here was assigned by the author, not measured: the axes have no units andthe figure is not evidence. Tiers follow 0.42 times interpretive distance plus 0.58 times consequence, and anything past theconsequence floor is Tier C. It synthesises DACS description control, Colavizza and Jaillant’s AI preparedness guidelines, and NISToversight and override concepts. Illustrative framework. Control follows intended use and consequence, not model type or confidencescore alone.Verified 30 July 2026archively.ai/research-notes/01Static view: OCR or transcript text, used as public archival description.INTERPRETIVE DISTANCE FROM THE SOURCELowExtractedModerateSummarisedHighInferredCONSEQUENCE FLOORTIER ATIER BTIER C12345678910CONSEQUENCE OF AN ERROROUTPUT CLASSTIER1TranscriptA2Dates, entitiesB3CaptionsB4Title, scope noteB5Authority linksC6RelationshipsC7Admin historyC8Biographical noteC9Sensitivity signalC10Rights decisionCTIER AProvisional or internalTIER BAccepted public descriptionTIER CHigh consequence orcontestedPositions are assigned by the author, not measured.

The same machine output can need light review or specialist review, and which one it needs is decided by the use, not by the model or its confidence score.

An example state, not a recommendation.

1OCR or transcript text

used as public archival description

Tier A: Provisional or internal

Evidence needed
Enough to spot a clear error: the passage as imaged, beside the transcribed text.
Who reviews it
Any trained staff member working within the approved scope.
Decisions available
Accept, modify, reject, or leave provisional.
Second review or escalation
Not routinely indicated.
What users are told
The record states that part of the description began as a machine proposal, and gives a correction route.
What is retained
The proposal, the disposition, and who made it.

A model may proposeA model may propose. An authorised person disposes.

Ten classes of machine output, positioned by how far each sits from the source and what an error would cost. The intended use decides where a class sits on the consequence axis: an imperfect transcript is a minor nuisance in an internal finding aid and a misquotation in a published record. The tiers describe review depth, not permission.

Illustrative framework. Control follows intended use and consequence, not model type or confidence score alone.

Author’s proposed framework. Every coordinate here was assigned by the author, not measured: the axes have no units and the figure is not evidence. Tiers follow 0.42 times interpretive distance plus 0.58 times consequence, and anything past the consequence floor is Tier C. It synthesises DACS description control, Colavizza and Jaillant’s AI preparedness guidelines, and NIST oversight and override concepts. On screen this figure answers its own controls. The files below, and the printed plate, hold one state of it and name that state on the drawing.

Last verified

Figure files:SVGPNG 16:9PNG 4:5
Text version:Read Figure 3 as text

A scatter plot. The horizontal axis is the consequence of an error, labelled low, moderate and high. The vertical axis is interpretive distance from the source, labelled extracted at the bottom, summarised in the middle and inferred at the top. Three shaded bands run diagonally across the plot, light to deep, each carrying its own name: Tier A, provisional or internal, at the lower left; Tier B, accepted public description, across the middle; Tier C, high consequence or contested, at the upper right. A single vertical rule near the right of the plot marks the consequence floor, past which the tier is C however mechanical the output is. Ten output classes are plotted as small filled circles with their numerals set beside them: transcript text, dates and named entities, captions, title and scope note, authority links, relationships, administrative history, biographical history, sensitivity signal, and rights decision. A numbered key gives each class its name and the tier it falls in under the intended use currently shown. The figure opens on an example: class 1, OCR or transcript text, used as public archival description. That point is drawn larger, in archival blue, on a dotted line marked same output, four uses, whose four square stops are the positions the same class would take under each of the four intended uses. Choosing a different intended use, from internal discovery aid, staff working draft, public archival description, and rights or access decision, moves every point horizontally and can change its tier. A full table of tiers by output class and intended use follows the figure.

The figure plots ten classes of machine output on two axes: how far the output sits from the source, and what an error would cost. Three control tiers run diagonally across the plot. The intended use decides where a class sits on the consequence axis, because the consequence of an error is a property of the use rather than of the model. The table gives the tier for each output class under each intended use.

Control tier by output class and intended use (illustrative)
Output classInternal discovery aidStaff working draftPublic archival descriptionRights or access decision
1. OCR or transcript textTier A: Provisional or internalTier A: Provisional or internalTier A: Provisional or internalTier C: High consequence or contested
2. Dates and named entitiesTier A: Provisional or internalTier A: Provisional or internalTier B: Accepted public descriptionTier C: High consequence or contested
3. CaptionsTier A: Provisional or internalTier B: Accepted public descriptionTier B: Accepted public descriptionTier C: High consequence or contested
4. Title and scope-and-content noteTier B: Accepted public descriptionTier B: Accepted public descriptionTier B: Accepted public descriptionTier C: High consequence or contested
5. Subject or authority linksTier B: Accepted public descriptionTier B: Accepted public descriptionTier C: High consequence or contestedTier C: High consequence or contested
6. Agent and collection relationshipsTier B: Accepted public descriptionTier B: Accepted public descriptionTier C: High consequence or contestedTier C: High consequence or contested
7. Administrative historyTier B: Accepted public descriptionTier B: Accepted public descriptionTier C: High consequence or contestedTier C: High consequence or contested
8. Biographical historyTier B: Accepted public descriptionTier C: High consequence or contestedTier C: High consequence or contestedTier C: High consequence or contested
9. Privacy or sensitivity signalTier B: Accepted public descriptionTier C: High consequence or contestedTier C: High consequence or contestedTier C: High consequence or contested
10. Rights or access decisionTier C: High consequence or contestedTier C: High consequence or contestedTier C: High consequence or contestedTier C: High consequence or contested
Tier A: Provisional or internal
Visible limitations, sampled or targeted review, no authoritative publication.
Tier B: Accepted public description
Source verification, an authorised disposition, and a retained decision record.
Tier C: High consequence or contested
Specialist review, escalation or second review, and community or legal input where relevant. A no-AI outcome is permitted.

Share this figure